Slum Heat Risk
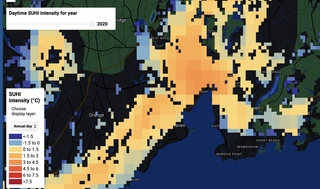
About one in three urban residents of the Global South live in slums. The global slum population is about 1 billion. This number will double in the next three decades due to urbanization and rising inequality. We believe that slum neighborhoods are much hotter than city mean conditions. Our goal is to quantify dry heat (air temprature) and humid heat (wet-bulb temperature) risk in slum neighborhoods, using mobile sensors, station mesonets, and satellite monitoring.
Biking for Science
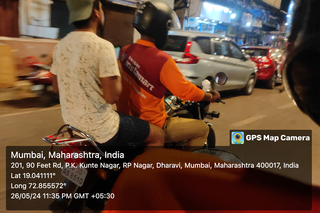
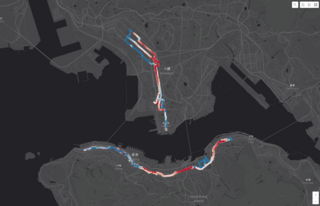
We deploy smart environmental sensors for monitoring and mapping heat stress and air quality in urban environments. Installed on public and private bicycles, these sensors measure health-related environmental variables (temperature, humidity, carbon dioxide, ozone and particulate matter) and tag the measurements with spatial coordinate information using the cyclist’s smart phone. Participating cyclists become citizen scientists, collecting data as they travel city streets.
Climate Model
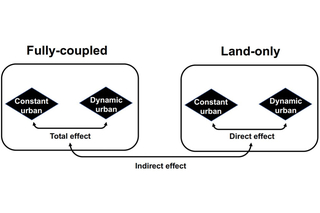
We use NCAR’s Earth System Model to study the effects of land use and land use change on surface climate. Factorial numerical experiments aim to isolate the intrinsic biophysical mechanism and land-atmosphere feedback. Another focus is application of subgrid data and parameterizations in study of local land effects (urban, small land clearing, cropland expansion, lake), often involving comparison with paired eddy covariance observations and diagnostic analysis of surface energy balance change.
Taihu Eddy Flux Mesonet
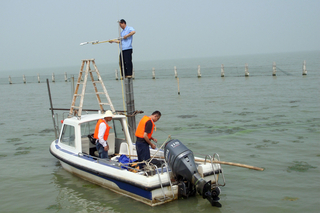
Lake Taihu is a large (area 2400 km2) and shallow (mean depth 1.9 m) freshwater lake in Eastern China. In a long-term monitoring program called Taihu Eddy Flux Mesonet, we measure CO2, CH4, N2O, energy, water and momentum fluxes across the lake, using eddy covariance and micrometeorological instruments. Data are used to improve lake-air parameterizations, to quantify evaporation reponse to climate warming, and to understand the role of algae in greenhouse gas fluxes.
Drone Zone
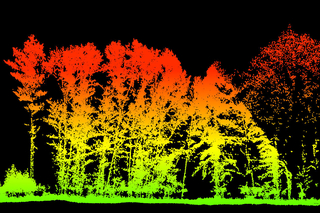
Located in the Yale Myers Forest, the Drone Zone is a tract of land marked for the development of drone survey methodologies. Consisting of forests of different management legacies, it has spatially explicit plot networks on the ground. Sensors range from simple RGB to multispectral, high and low resolution thermal, LiDAR, and acoustic monitors. We want to obtain individual tree-level information and to compare flight heights, data processing methods & drones and sensors at varied price ranges.
Internet of Things (IoT)
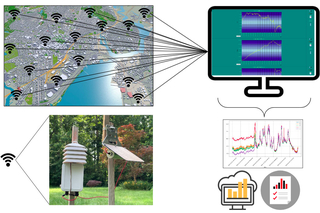
Cities are CO2 emission hotspots. Timely monitoring of city CO2 emission is needed to optimize local energy use and to inform carbon mitigation strategies. We aim to develop smart IoT CO2 sensors for emission monitoring. These sensors are low-cost, powered by solar panel, interconnected via a data server, and deployed in large quantities. They are calibrated with machine learning algorithms. A Bayesian inversion method is deployed to obtain emission flux from distrbuted CO2 monitoring.
Water Vapor Isotopes
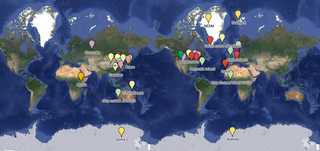
Hosted by Yale University and sponsored by the U. S. National Science Foundation, the Stable Water Vapor Isotope Database (SWVID) website archives high-frequency vapor isotope data collected with instruments based on infrared isotopic spectroscopy. The goal of this centralized data depository is to facilitate investigation that transcends disciplinary and geographic boundaries. The datasets have been quality-controlled and in most cases have been published in peer-reviewed journals.
Global Surface UHI Explorer
This app displays surface urban heat islands (UHI) at a global scale from 2003 to 2020. Use the search bar or pan over the map to find your urban cluster of interest. Click anywhere within the boundary of an urban cluster, and the cluster mean statistics will be listed in the space below. You also have the option to subset and download the gridded SUHI intensity rasters for the selected urban cluster at the bottom of the panel.
